Table of Contents
Overview
Get ready to neuroimage!
1. Install Mango software
You will need to install the Mango viewer software to do this part of the assignment. In general, I prefer not to ask students to download software, but currently there are no browser-based MRI image viewers available online that provide all the features we need. I have chosen Mango to download because it is non-commercial (so that there are no ads or additional software that come with it), free1), and designed to work with all major operating systems.
http://ric.uthscsa.edu/mango/mango.html
- Click on the link for your operating system, and follow the prompts. The website includes some instructions too.
2. Download a file to use with Mango
As you know, functional MRI (fMRI) measures differences in blood oxygenation levels. For technical reasons, fMRI images usually need to be relatively low-resolution (they look blurry). Also, the goal of most fMRI studies is to identify small, specific regions of the brain that are associated with a cognitive task. The final results of most fMRI studies (which are usually called “activation maps”) don't look like a picture of a whole brain, or even of a recognizeable part of a brain. They just depict little three-dimensional blobs that mark the location of the brain regions most highly associated with the cognitive task from the study. So, the blobs that are visible in an fMRI activation map are like the Xs that “mark the spot,” but without the underlying treasure map! Looking at activation maps on their own is like looking at a blank piece of paper with an X on it – it tells you that there is, in fact, a treasure/important brain region, but not where to find it.
To understand which locations the activation blobs (the “Xs” in the treasure map analogy) mark in the brain, we need to “put the map under the Xs.” In our case, the “map” is an image of a whole brain (in 3D of course). The image that we will use is a composite image based on averaging together the structural MRI images of 152 individual brains. (Structural MRI images are high-resolution images that look more like a photograph than functional MRI images, and they don't measure blood oxygenation.) This average image is a little too smooth around the edges to look like a real, single person's brain, but that's the point: we want to understand where an activation blob would be located on average, in anyone's brain.
So, please download a file available on our Canvas site:
File name: mni_icbm152_t1_tal_nlin_asym_09a_acMasked.nii.gz
(NOTE: If your computer asks you to unzip this (or do anything else) with this file, respond “No.” The only reason this file is zipped (compressed to reduce the size of the file) is to make it easier to download and save. Mango will read this file without you having to unzip it first.)
Make a note of where the downloaded file gets saved, so that you can open it later. You can ask your web browser to show you where the file was saved in a number of ways, including:
- In Firefox: Under the “Tools” menu, select “Downloads.”
- In Chrome: Under the “Window” menu, select “Downloads.”
This file is a version of the standard 152-person average brain created by the Montreal Neurological Institute (MNI) in Canada. You will see this abbreviation a few times during this activity, because the MNI originated a number of widespread neuroimaging techniques. The only difference between this version of the file and the standard version available online from the MNI is that your instructor has removed the face, skull and other non-brain portions of the image, so that it will look more like a brain when we eventually view a 3D rendering of it.
3. View the structural average brain in Mango
Now that we have …
- The Mango viewing software
- A copy of the structural average brain file
… we can look at the average brain.
3.1 Start the Mango app
I feel funny writing instructions to you youngsters about how to open apps, because you know, you're more familiar with “apps” than me. However, problems can occur, and please don't hesitate to ask if they do.
3.2 Open the structural average brain file: the "image"
Somewhat confusingly, Mango uses different words when it refers to 1) the structural brain image, and 2) the functional activation map image. To me, these both count as “brain images.” However, Mango calls the structural brain file an “image,” and it refers to functional activation maps as “overlays.” This is only important because there are different menu commands for the two kids of files.
To load the average structural brain image, use the mouse menus to select “Open image,” as seen here:
Select the file that you downloaded from Canvas.
Congratulations! You made a brain appear! It should look like this:
3.3 Enable the atlas feature
Mango can show us the name of the brain region that is under the mouse, but we need to enable this feature first. Mango looks up the most likely name for each brain region using a data set called an “atlas.” Click on the button in the main Mango window (which is actually the smaller window) that looks like a sphere, and then select “Atlas → MNI (Nearest Gray Matter)”.
Technically, the names of the brain regions (the “atlas labels”) only describe regions of gray matter. However, because our structural brain image is an average brain, it is very possible that some individual people's brains will have gray matter in locations that correspond to white matter in the average brain. A consequence of this is that functional activation blobs can sometimes appear to be located in white matter on the average brain. In those cases, we still want to know what to call that part of the brain.
Mango will display four different names with different levels of specificity. The one we want is the one at the upper right of the atlas window, e.g. “Sup Temporal Gyr” for superior temporal gyrus.
HINT: if the atlas abbreviations are unclear, try Googling them.
Get brain maps from the Neurosynth website
1. Go to the Neurosynth homepage in your browser
2. Get a meta-analysis for your article's topic
Neurosynth provides a very interesting service: it allows us to view something like the most probable functional activation map that we could expect from an fMRI study if all we knew about the study were its keywords.
Because of this, the terms or keywords that we enter in Neurosynth can make a big difference in the activation maps that we get back. In particular, the level of specificity of the terms can make a big difference. For example, as we know from class, the English word “memory” refers to many different cognitive processes, including many that probably rely on distinctly different brain regions. If we enter the query “memory,” Neurosynth will return a map showing the likely locations of functional activation across all published studies that featured the word “memory.” This will lump together “apples and oranges” – distinctly different patterns of activity produced by qualitatively different cognitive processes that happen to share the term “memory” in their names, like “episodic memory” and “working memory.”
2.1 Select a Neurosynth term to use
Choose a term that captures the meaning of your week's topic, and type it into the “Terms” search box on Neurosynth. Sometimes the term you chose might not be part of the Neurosynth database, in which case you'll have to choose a similar term that is.
2.2 View the meta-analysis for your term
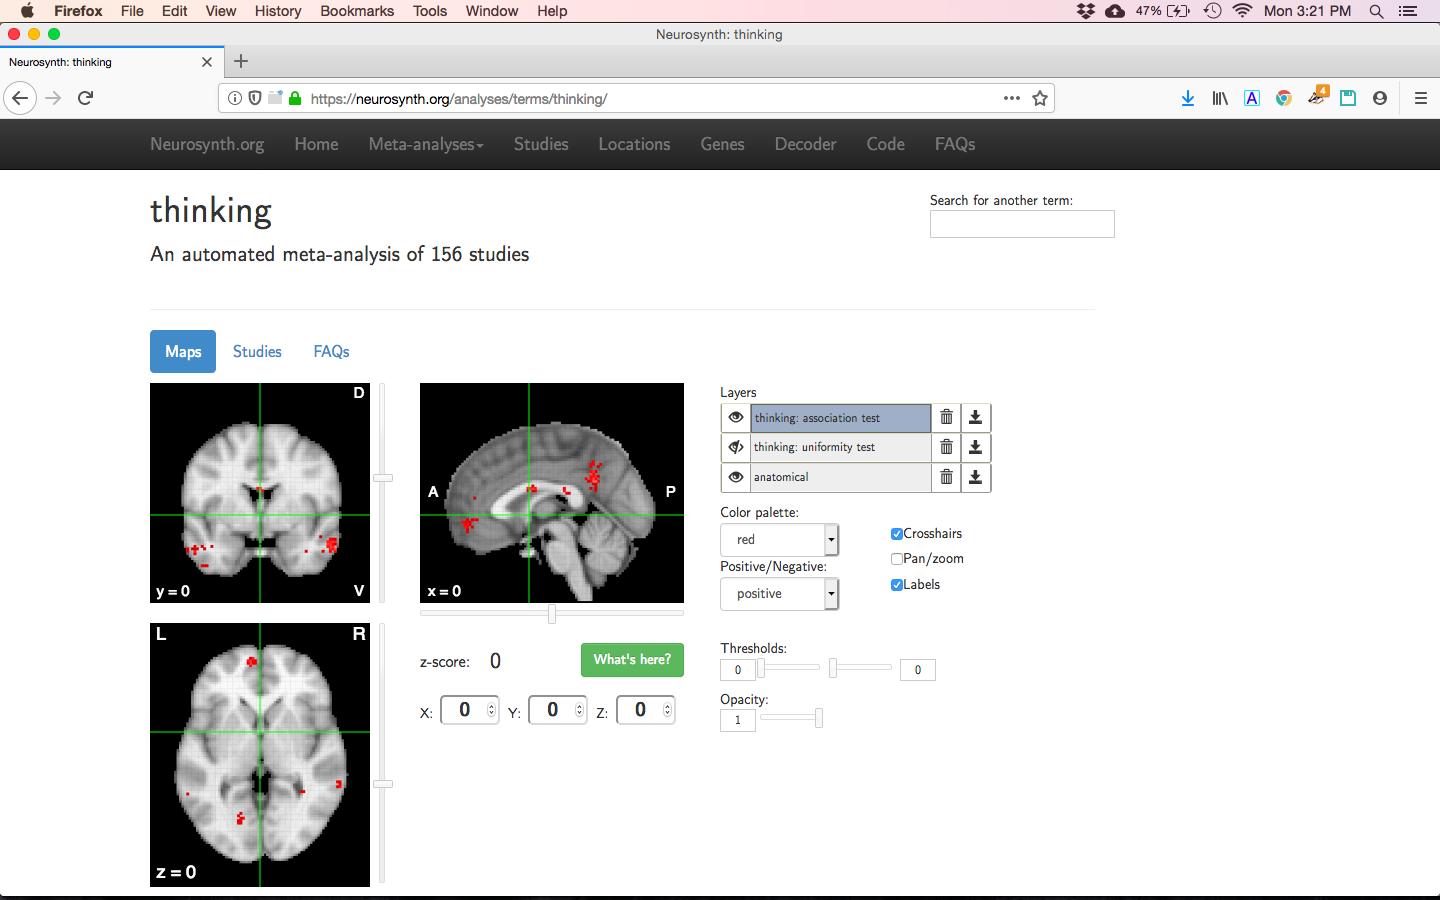
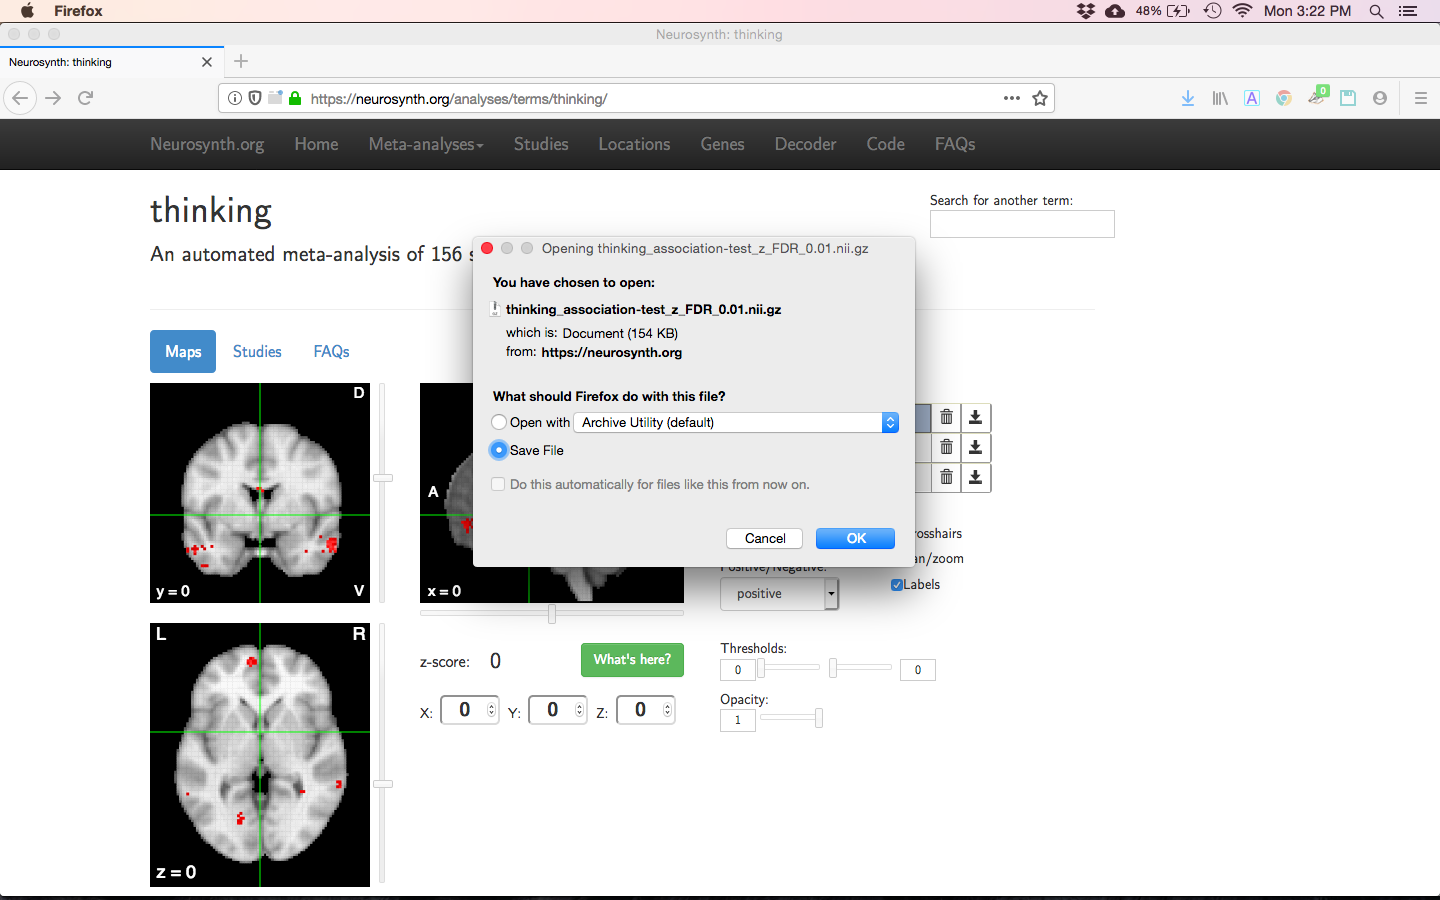
2.3 Download the brain map image for your topic
Explore brain map images using the Mango viewer
Follow the instructions above to open the average structural brain image and enable the atlas feature.
Again, the average structural brain image forms the background over which your functional activation maps will be overlaid.
1. Examine the Neurosynth brain map that you downloaded
Mango refers to functional brain maps as “overlays,” in contrast to the structural brain map, which is the “image.” Mango can only open one “image” at a time, but it can have multiple overlays open simultaneously.
Now we can open the first file that you downloaded from Neurosynth. DON'T use the first Mango window's “Open” menu, even though that sounds like a good choice. Instead, use the “File” menu on the viewing window that is displaying the structural brain image.
If you get the warning shown in the figure below, just click “OK.”
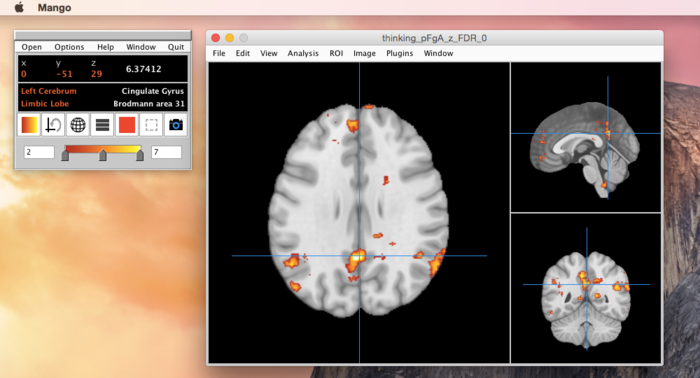
With any luck, you will now see bright orange/red blobs superimposed atop the structural brain image.
NOTE: Mango (and most other neuroimaging software) cannot display the entire brain at once. Mango's viewing window shows three different 2D views centered on the same crosshairs, but these three views still can't reveal the entire 3D volume of the brain. This means that there can always be functional activation blobs “hiding” somewhere just out of view.
If you don't see any orange/red activation blobs after loading your first overlay, try clicking and dragging the mouse all around the brain, moving the blue crosshairs, until you've looked all over the entire brain. There is almost certainly a blob there somewhere.
it is possible that your particular Neurosynth map might not have any activation blobs that happen to be visible at the current view of the brain.
Even if you are rewarded by seeing a brainful of orange/red activation blobs immediately after loading your overlay, you should still click and drag the mouse around to explore the entire brain. You can do this within any of the three different panes of the viewing window. Mango will keep all three panes in sync, i.e. focused on the same point marked by the crosshairs.
1.1 Find a key brain region from your term
Refer to the collaborative discussion and/or your own knowledge about the topic and decide on a brain region that is important for the week's topic. See whether that brain region is included in the meta-analysis activation map (i.e. the red blobs). If not, then choose a different brain region that is included in the activation map.
For this assignment, we can determine whether a brain region is included in the activation map using what we can call “the click/scroll/hover method.”
- Find the part of the brain in question by clicking/scrolling around on the average structural brain map, and then getting the proper atlas label to appear by hovering the mouse over the correct part of the structural brain map. This will put you in the correct general area of the brain.
- Get a good approximate sense of the boundaries of the region that corresponds to the atlas label, by clicking/scrolling/hovering the mouse around until the atlas label changes.
- Now you can judge whether any of the Neurosynth brain map activation regions (i.e. the colorful blobs) fall in that region.
This is not a precise method, but it is more than good enough for our purposes. The small amount of extra precision that we would get by using other methods would not be worth our time here. It is actually quite tricky to name the brain regions covered by an activation blob. Just for starters, the boundaries of brain regions are not always clear-cut, and even the names for various brain regions are not agreed upon by all scientists. Then there is the whole issue of using an average structural brain to guide us, when individual brains can be so different from each other.
Potential problems with finding a brain region
Here are two problems that we do need to address before going ahead with the click/scroll/hover method.
Different names for the same brain region
“What if the atlas label names are different from the names that our review article used for brain regions?”
Answer: You can trust your judgment and decide when you think the Mango atlas label is just another name for the region mentioned in your article. More to the point, I (the instructor) will trust your judgment, too. Just be sure to write down both names in your answer, for example:
“My article named the 'middle cingulate gyrus,' but Mango doesn't have an atlas label with that name. Part of the Neurosynth activation map did overlap with the middle of the region that the atlas labeled 'Cingulate gyrus,' though. Therefore, my answer is yes, the middle cingulate gyrus does appear on the Neurosynth activation map.”
I'm not a brain expert (yet)
“How do I find a brain region in Mango without clicking/scrolling/hovering over the whole dang brain? You (the instructor) said I didn't need to know how to read MRIs.”
Answer: Try Googling the name of the brain region you're looking for. Try searching for images, if necessary. Then use the results as a guide of where to look in Mango.
Take a screenshot of the region
Take a screenshot of Mango when you have placed the crosshairs on the region in question.
NOTE that the crosshairs are not the same thing as the mouse pointer; to place the crosshairs (the two thin blue lines) you need to click the mouse.
PLEASE USE THE MANGO SCREENSHOT TOOL and not some other method for taking screenshots. Clicking on the “camera” icon in the main (smaller) Mango window will save an image file to the same folder that holds the average structural brain image file (i.e. mni_icbm152_t1_tal_nlin_asym_09a_acMasked.nii).
Paste the image file into the summary document template, in the “Brain region chosen for the term” section.
1.2 What other cognitive skills are associated with this region?
Copy down the MNI coordinates for the region
Copy down the stereotactic coordinates of the point in the brain marked by the crosshairs.
While the crosshairs are still marking the region, hover the mouse right on top of them. The reason for moving the mouse is that by default, the main Mango window (the small one) displays the coordinates for the location the mouse, and not for the crosshairs.
The 3D (or “stereotactic”) coordinates are given by 3 numbers (X,Y,Z), which appear in red font. The fourth number that appears in white font to the right of them is not important for us here.
There are two main coordinate systems that scientists have developed for referring to locations in the average brain: Talairach coordinates, and MNI coordinates. The two systems are similar, but not identical. The brain images that we are using (both the average structural brain and the Neurosynth functional maps) are in MNI coordinates.
Enter the coordinates in a Neurosynth "locations" search
Click the “Locations” link at the top of any Neurosynth website page, or navigate your browser to this url:
http://neurosynth.org/locations/
Type the three numbers (including any minus signs) into the “Data for coordinates” fields, and press the Enter key on your keyboard when you're done.
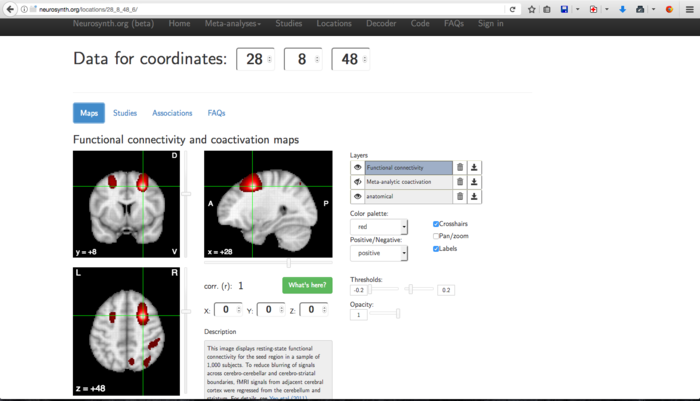
The web page will reload, showing a brain map with crosshairs and bright colors centered on the coordinates that you entered.
We will not use the “Functional connectivity and coactivation maps” that appear, but here is a brief explanation about them for those who might be interested. This color map represents something different from the meta-analysis activation maps that you produced earlier. This time, the color map indicates the probability that the location at these coordinates is “connected” with other locations in the brain. I put “connected” in quotes because the color map is not based on measures of anatomical connectivity, even thought those exist (e.g. diffusion tensor imaging maps of white matter pathways). Neurosynths' “Functional connectivity and coactivation maps” display something like the probability that other regions will be active in a functional MRI, given that the region under the crosshairs is active.
We will click on the “Association” link that appears above the brain map. The resulting web page gives a table listing the names of other Neurosynth meta-analysis maps (that already exist, somewhere on the Neurosynth web server) that have especially high values at the coordinates we entered.
We can use the names of these meta-analyses as a set of rough guesses about what other cognitive skills might be associated with this brain location. Again, the activation maps from Neurosynth meta-analyses are interesting because they represent pretty good answers to questions like, “If all I know about a neuroimaging study is that the term X appeared in the article, which brain regions were likely to be active?” Right now we are considering something like the reverse question: “If all I know about a neuroimaging study is that coordinate X,Y,Z was active, what terms were likely to appear in the article?” It requires an additional leap of faith to guess that just because an article included the term “language comprehension” (for example), that our brain region is actively involved in producing that cognitive skill, but it's a great start.
Copy the table from the "Associations" page and paste it at the bottom of your answer.
Again, this table should have only 10 rows.
Paste the table into the proper location in the summary document template.
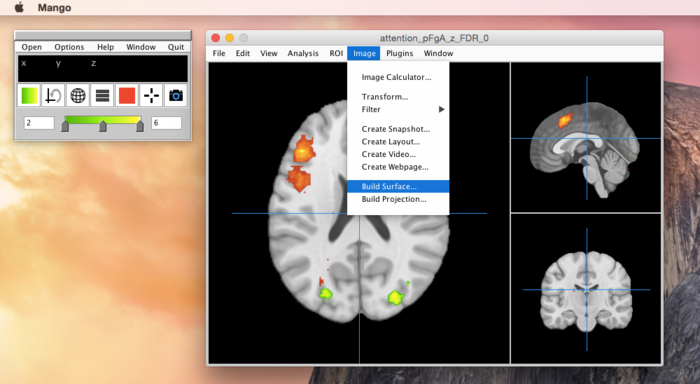
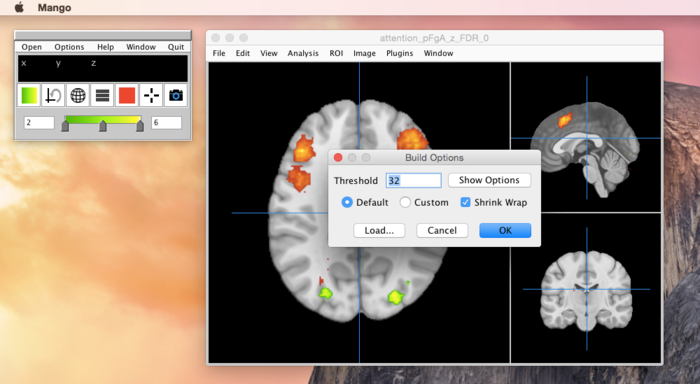
1.3 Make a 3D surface model
Make a 3D surface model showing the location of the region you chose (above).
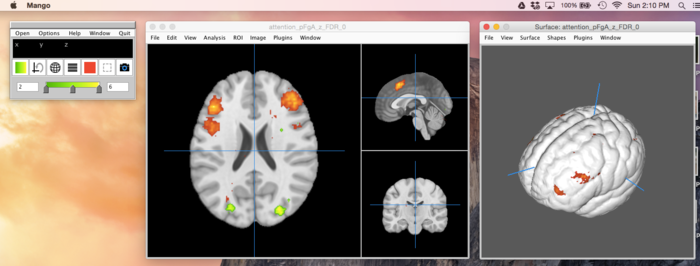
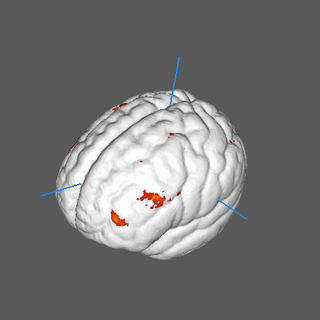
The only activation blobs that will be visible on the 3D surface model are those that actually extend all the way to the outside of the average structural brain image. However, we can see any blobs we want by enabling “cut planes” in the 3D surface window. A “cut plane” is a noun, short for “cutTING plane.” It is like an invisible knife that cuts through the brain in one direction and removes all the brain stuff on the side facing us, the viewers seated at our computers.
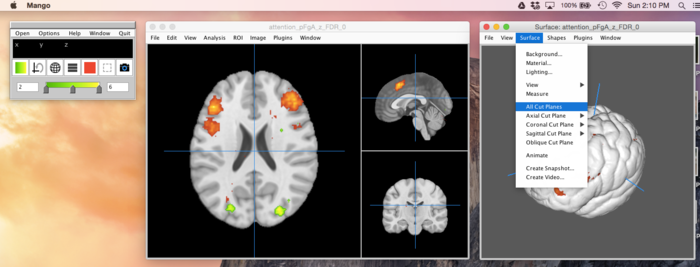
The “All Cut Planes” option sets up a set of three “cut planes” that intersect at the point marked by the crosshairs.
This is how the 3D surface model should look after selecting the “All Cut Planes” menu item.
The locations of the “cut planes” are linked to the crosshairs in the viewing window. To reveal different parts of the 3D surface model's interior, click and drag the mouse around in the viewing window (and not in the surface window).
Take a screenshot of the 3D surface model
Move the “cut planes” around until you have revealed a nice view of the 3D surface model's interior, so that blobs from the overlay are showing.
Submit a screenshot of your awesome, holey brain by doing this:
- Take a screenshot of the surface window.
- Paste the image into the proper location of the summary document template: the “Neurosynth map for the term” section.
*NOTE:* You must have the Mango surface window “highlighted” or “in focus” (by clicking on it) before you use the main window's “camera” screenshot icon. Only the “highlighted” window's contents will be saved to the screenshot.
It should look similar to this:
COMPLETELY NON-CREDIT OPTIONAL BONUS ACTIVITY:


