Table of Contents
Overview
This project created a method for classroom students to vote for one of two choices at each moment in time while watching videos.
Outline of technique
- Students watch a video and signal two different judgments about the content by holding up two different colored cards.
- The instructor records a video of the class holding up the cards. The original video will be converted to a blurred version that preserves the color information (and thus the number of cards held up at each time point) but which obscures faces to protect students' identities.
- The instructor runs automated analysis code that produces a version of the video that the student watched, with an animated bar graph superimposed on it that displays the number of votes for both judgments at each point in time.
- The class can watch this video to understand and evaluate how the class voted as a whole, and discuss the accuracy or agreement of the judgments.
Illustration of the method
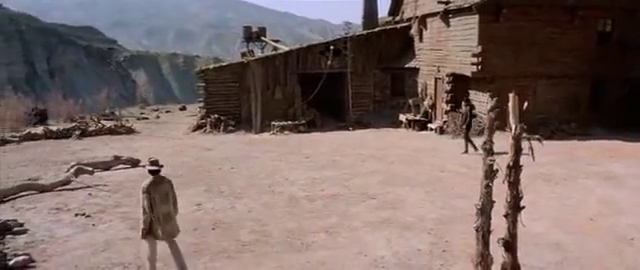
The class watches a video.
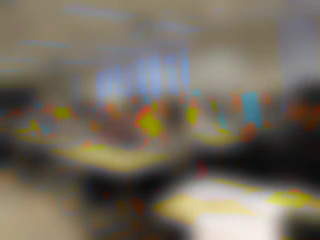
The instructor takes a video of the class to measure how many cards are held up at different points in time. The luminance channel (black/white information) is immediately blurred so that students can't be identified. The color information is left unblurred.
The video is analyzed by splitting it into three component channels commonly used for encoding video.
The channel that measures yellow-blue differences (the U plane) is analyzed to get a count of how many yellow and blue cards the students hold up at each point in time.
To measure the amount of yellow and blue in the image, two different versions of the grayscale image are produced. One version includes all the pixels that fall below a specified threshold (yellow things) and another all the pixels that exceed a higher threshold (blue things). Both of these images are adjusted so that farther away parts of the scene count more than closer ones. This makes sure that farther away cards (which appear smaller in the images) count as much as closer ones.
The amount of brightness (the pixel values) in each image is summed up, and these tallies stand for how many yellow and blue cards were visible at that point in time. One tally is made for every frame of the video, which means that there are about 30 tallies per second.
Some parts of the image correspond to yellow (the desks) and blue (the windows) things. However, these things don't change from second to second in the video, unlike the cards that students hold up. All of the tallies for all of the thousands of video frames are compared, and the minimum tally value is then subtracted from all frames' tallies. This subtracts away the baseline amount of yellow or blue that is constant across video frames.
The values of all the frames' tallies can then be normalized to lie on a scale between zero and one, and can be graphed like this. Higher values indicate when more cards were being held up.
The numbers in the line graph above are used to draw little bar graphs on top of each of the video frames, so that viewers can see how many cards of each color were held up at each moment.
In this example, students held up their yellow cards when they thought the movie camera was being physially moved around to create motion on the screen. They held up their blue cards when they thought that the camera was being pointed at different spots (panned) or when the zoom was being changed to create motion on the screen.
How it works
YUV video encoding
Trigonometry to scale the area of the cards
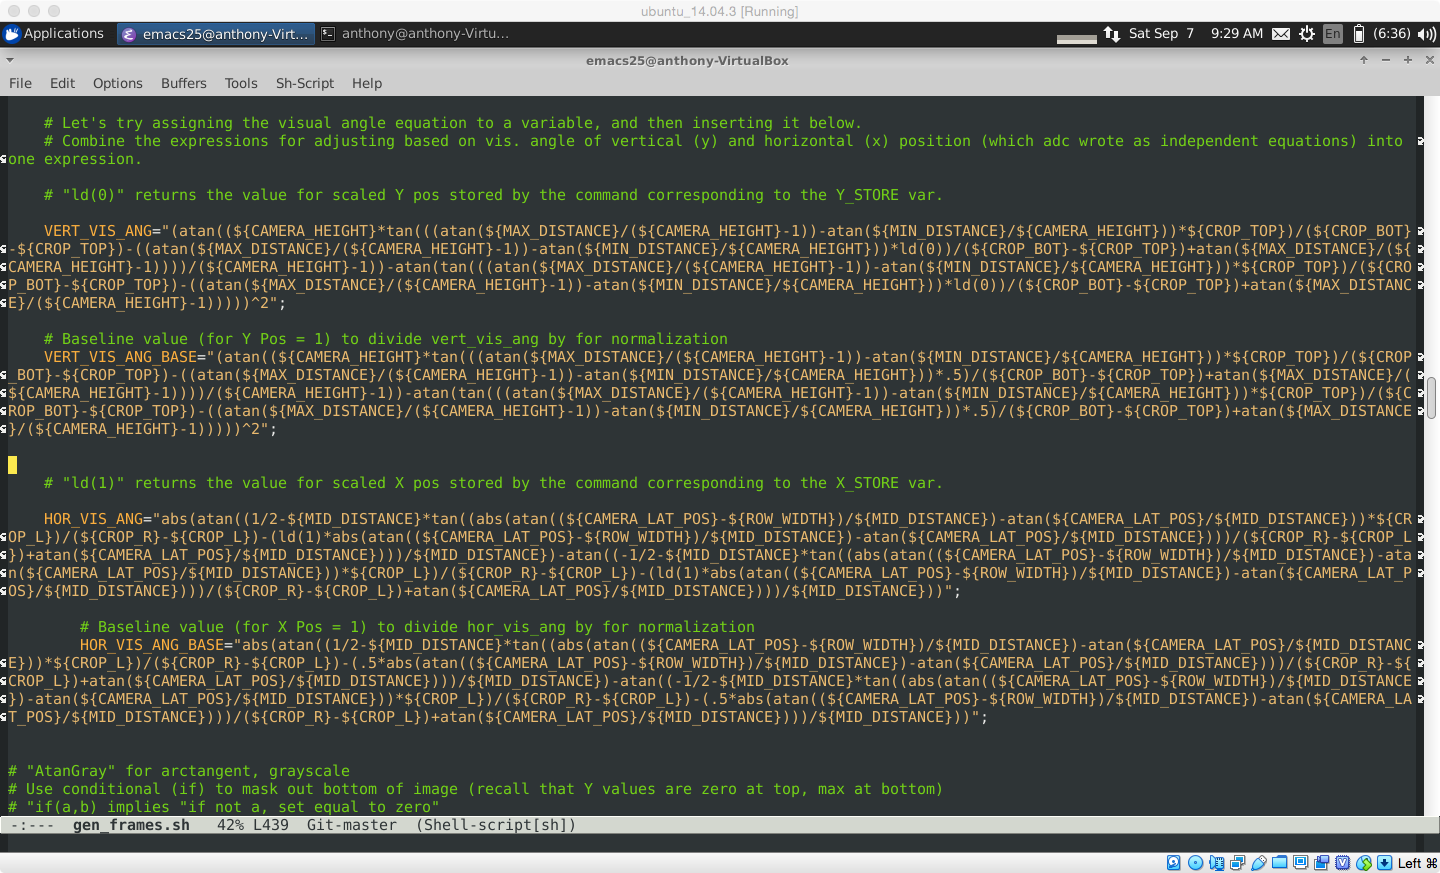
The transformation of U plane pixel values to account for distance from the camera is complex, but it is still just trigonometry. The person making the recording of the class needs to note the dimensions of the classroom, the position of the camera (including height off the ground), and the average height at which the cards were held up. Here is a screenshot of the code that performs the transformation, just to give a sense of the complexity.


